3'-end sequencing test
Here, I tested 3’-end libraries sequencing results.
Samples
| Sample | Quantity | 260/280 | 230/280 | RIN | Tube id |
|---|---|---|---|---|---|
| S1 | 16.3 ng/ul | 1.88 | 0.57 | 8.3 | 1 RNA 16S 06.11 |
| S2 | 17.8 ng/ul | 2.2 | 2.18 | 9.2 | 1.8 RNA 12.11 |
The libraries were constructed 3 times from each sample, pooled together and sequenced. In total, 6 files with raw reads were analyzed:
| file prefix | description | starting amount | fragmentation | PCR cycles | comments |
|---|---|---|---|---|---|
| TM1_S1 | preparation 1, sample 1 | 200 ng | 60 s | 15 | |
| TM1_S2 | preparation 1, sample 2 | 200 ng | 60 s | 15 | |
| TM2_S1 | preparation 2, sample 1 | 200 ng | 75 s | 18 | |
| TM2_S2 | preparation 2, sample 2 | 200 ng | 75 s | 18 | |
| TM3_S1 | preparation 3, sample 1 | 200 ng | 75 s | 18 | for the 3rd cleanup we used gel cleanup instead of beads |
| TM3_S2 | preparation 3, sample 2 | 200 ng | 75 s | 18 | for the 3rd cleanup we used gel cleanup instead of beads |
Initial fastqc results
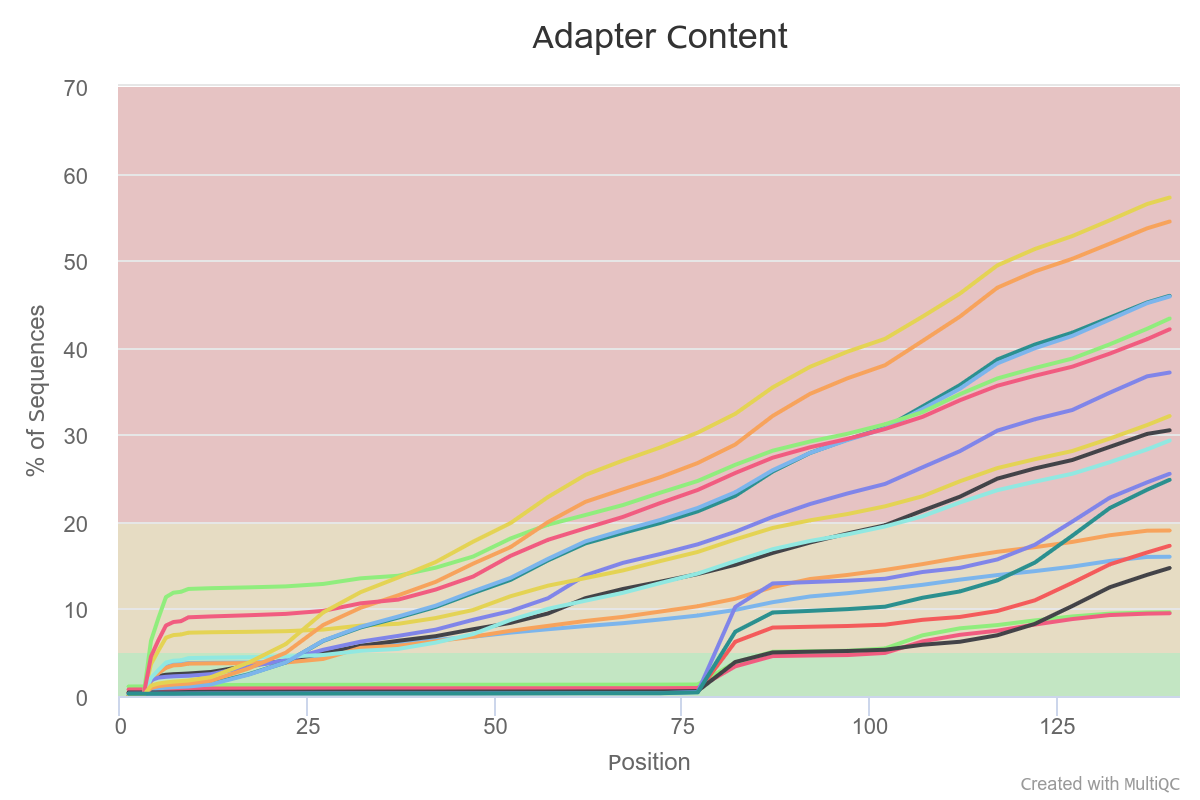
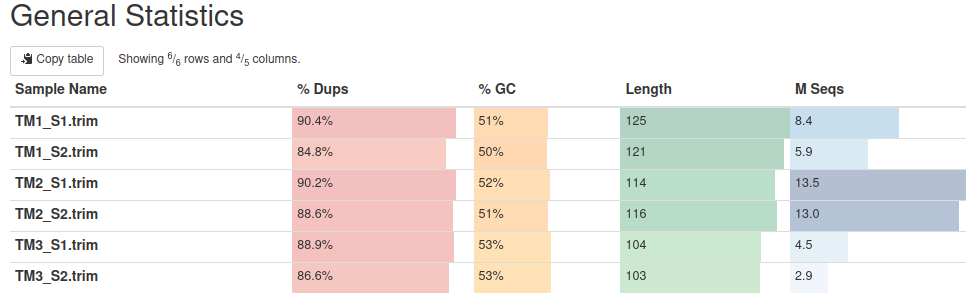
Initial quality was accessed with fastqc.
High duplication level and high polyA/adaptor content, as well as failed GC-content plot are normal for 3’-end data. The N of reads is different for each preparation - for TM3 it is below 10 million reads.

Overall per base quality is ok (the best is TM1).
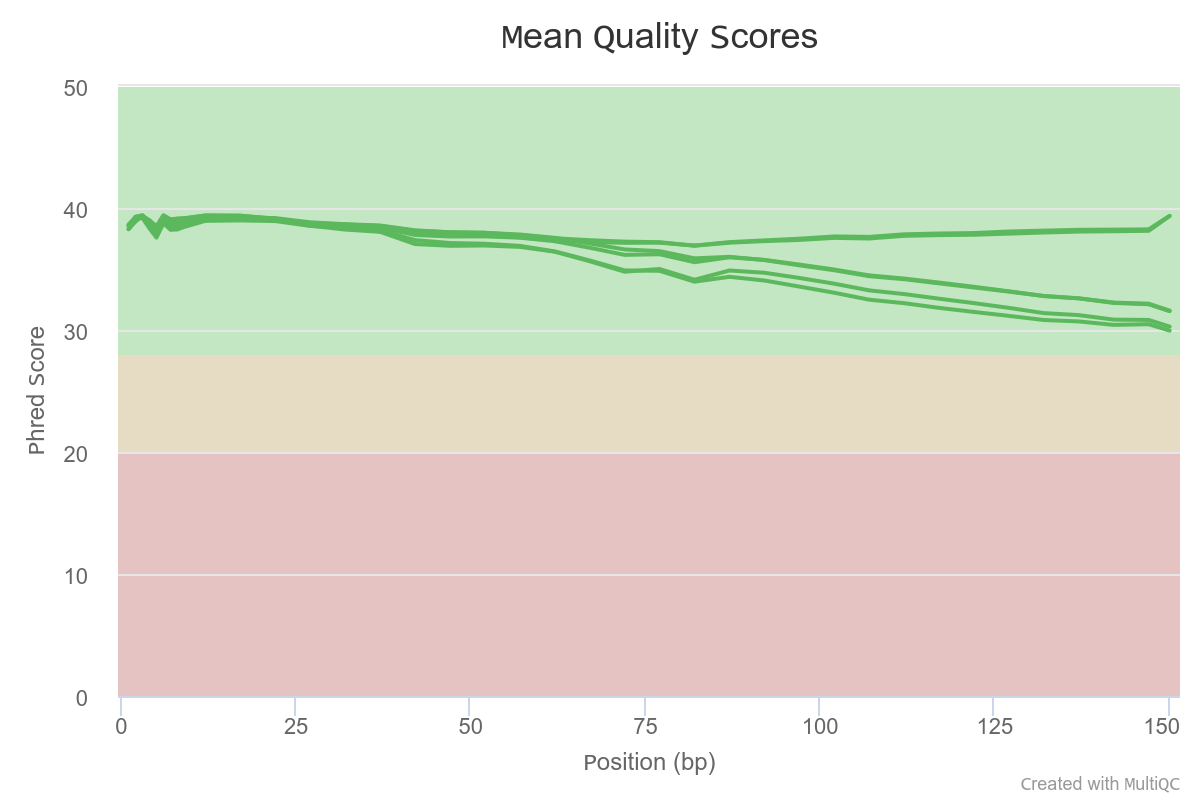
Overall, the quality of all samples is good. The sequencing depth for TM3 is surprisingly low.
Fastqc after trimming
Reads were trimmed with Trimmomatic to get rid of adaptors and polyA + to remove low quality bases (Phred < 30). Reads shorter than 30 bp were discarded. The number of reads reduced in each sample, but the most dramatical reduction was observed in TM3.
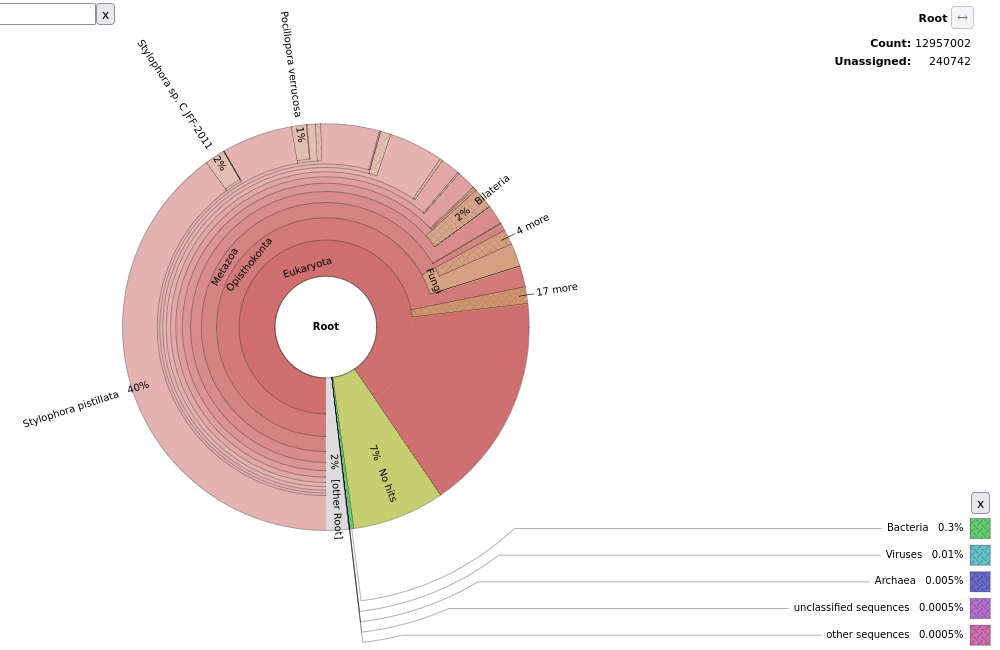
Taxonomic classification and contamination check
I run kraken2 to check the overall taxonomic classification of reads. In each sample, 90-95% of reads were classified into some group, and there were no contaminations. The results are very similar between samples.
STAR mapping to S. pistillata genome
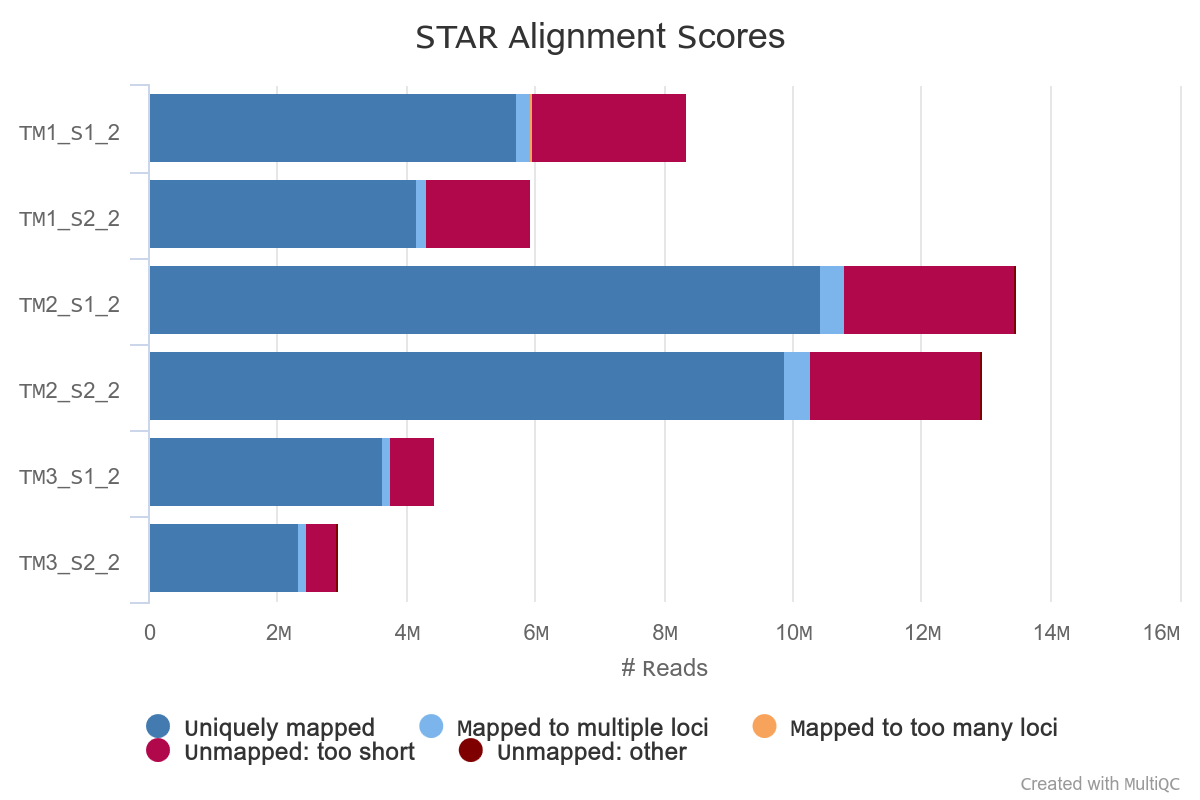
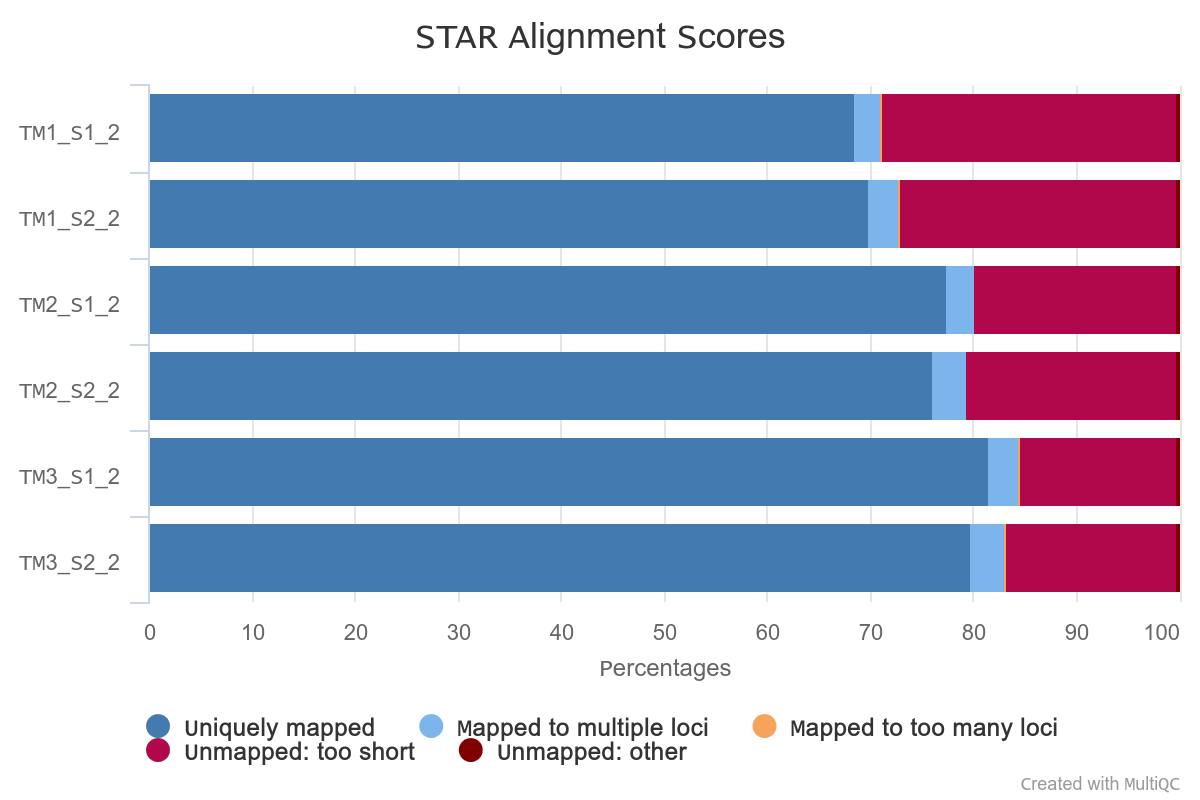
Reads were mapped to S. pistillata reference genome with standard STAR parameters.
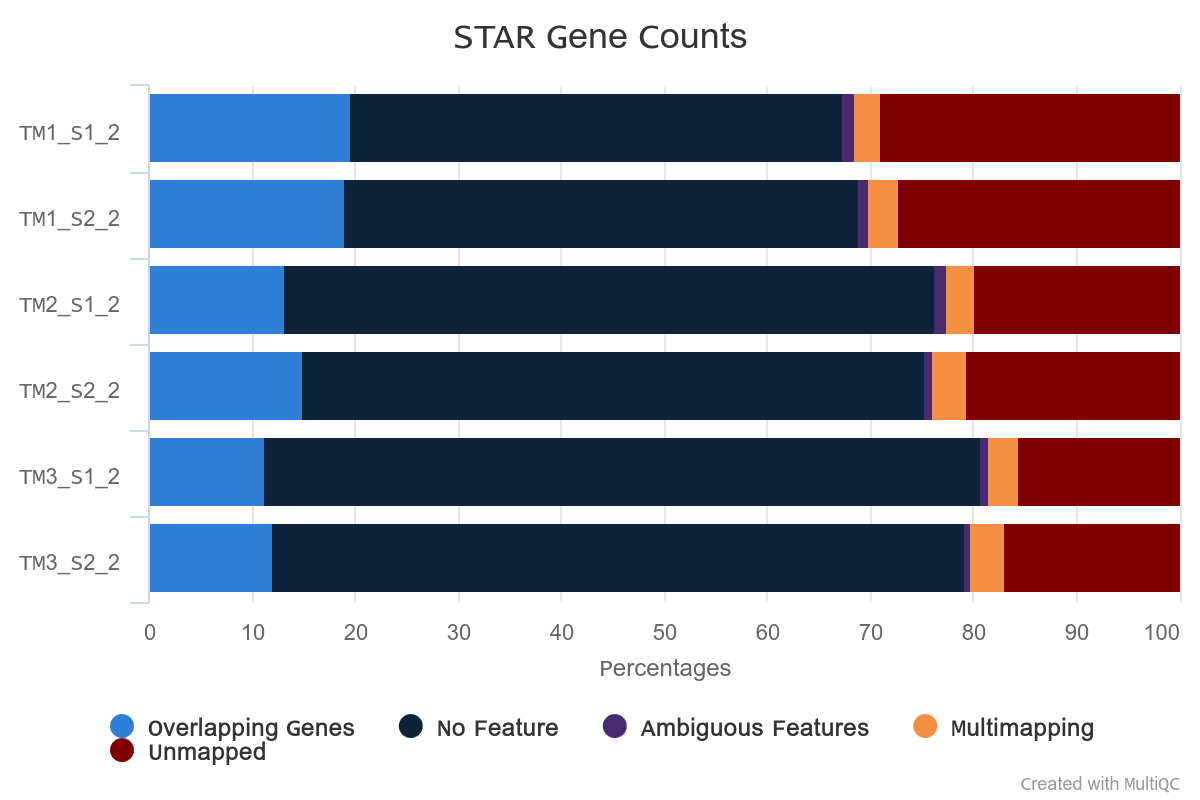
Overall alignment rate is high for each sample. The lowest percentage of aligned reads is observed in TM1.
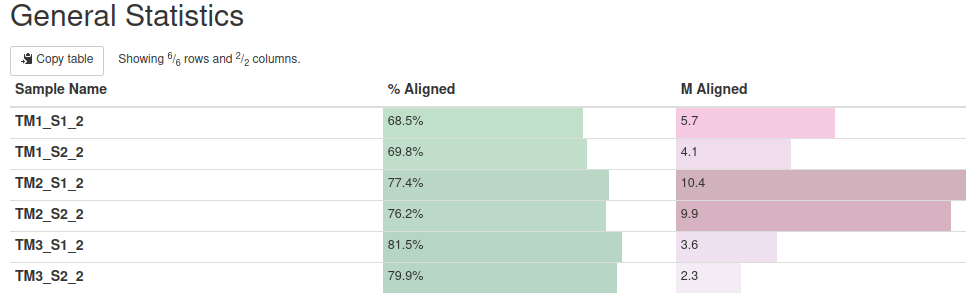
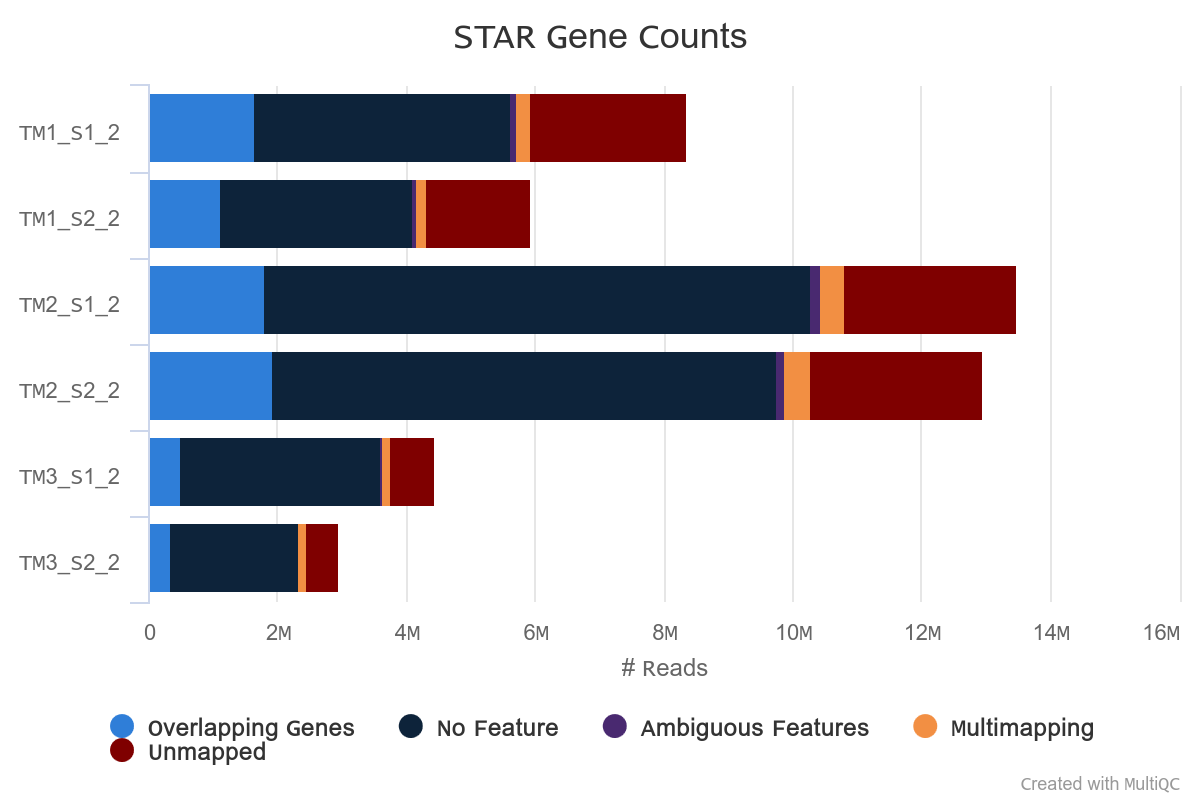
However, in TM1 the percentage of reads overlapping genomic features is higher.
Strandness
The results of strandness check via rseqc tool confirmed that TM1 and TM2 are strand-specific:
./star.basic/TM2_S2_2_Aligned.sortedByCoord.out.bam
Fraction of reads failed to determine: 0.0277
Fraction of reads explained by “++,–”: 0.9211
Fraction of reads explained by “+-,-+”: 0.0512
TM3 appeared to be non strand-specific:
./star.basic/TM3_S1_2_Aligned.sortedByCoord.out.bam
Fraction of reads failed to determine: 0.0088
Fraction of reads explained by “++,–”: 0.5295
Fraction of reads explained by “+-,-+”: 0.4617
Gene body coverage and 3’-skew
We expect that a 3’-end of a transcript has high coverage and the other parts of the transcript are less covered - coverage plots should be skewed as on the example from the paper (Lexo is a 3’-end library):
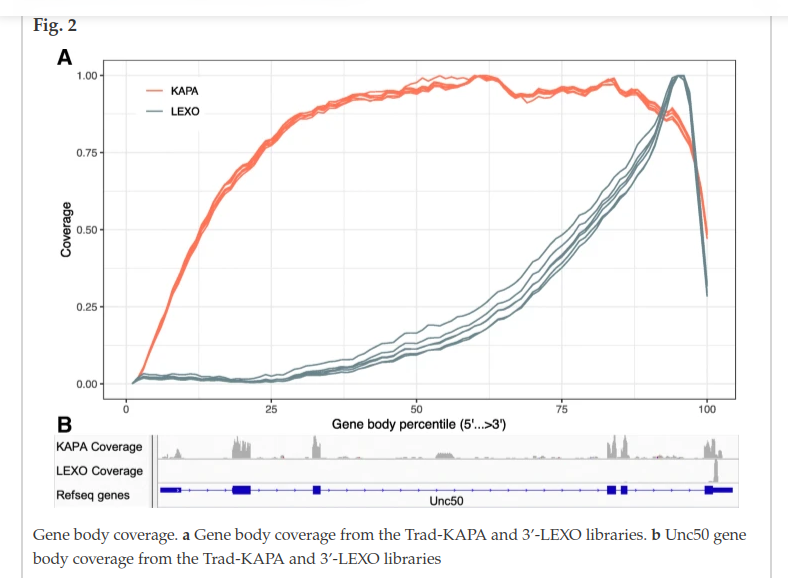
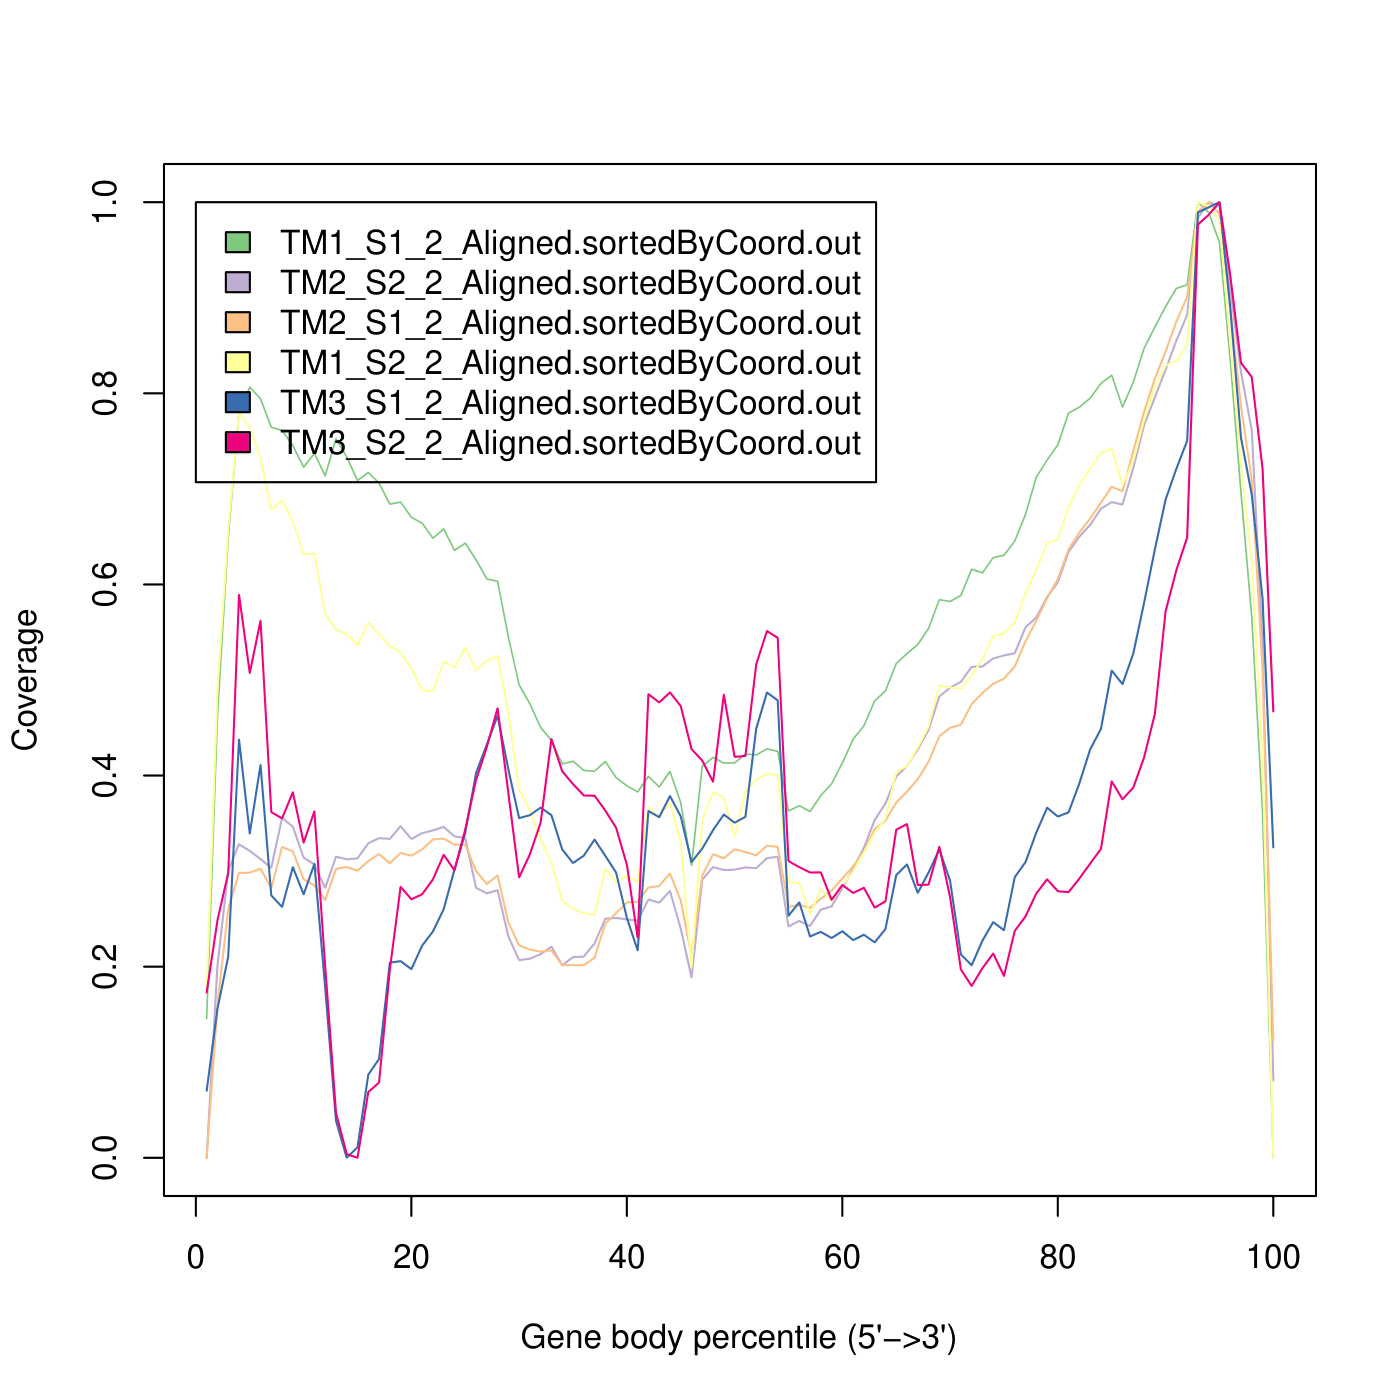
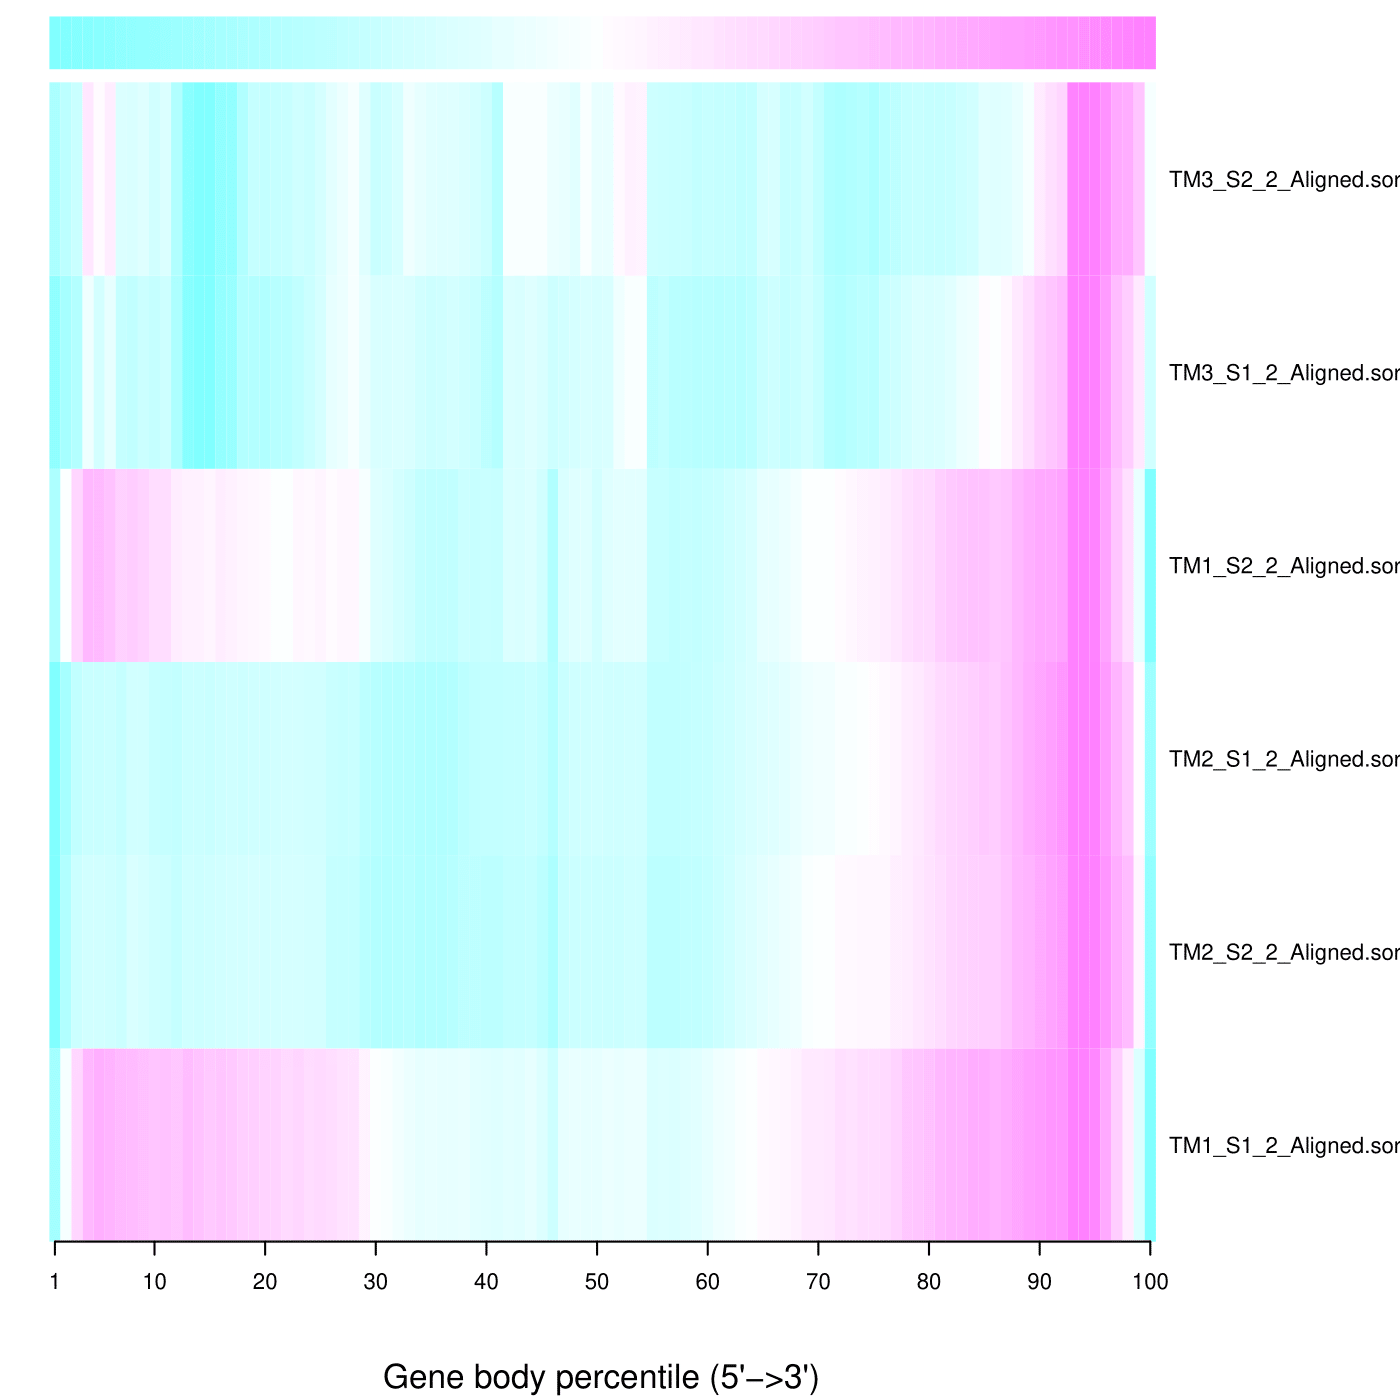
TM2 shows the result, which is more consistent with the paper, while in TM1 reads are also distributed across the 5’ end of the transcript.
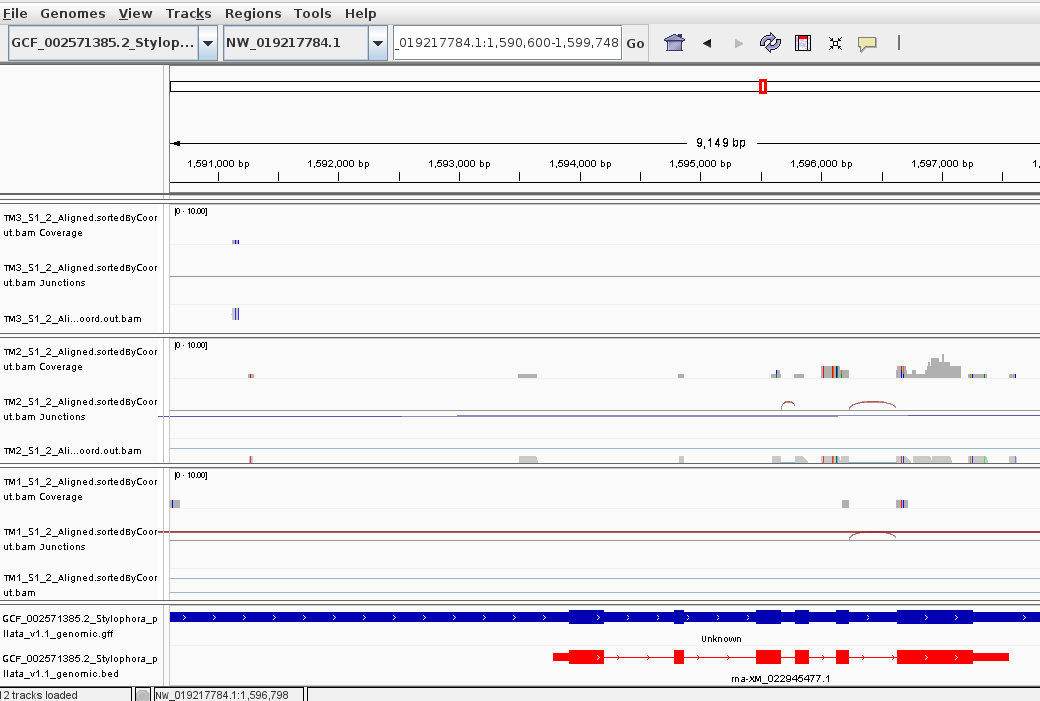
Random genes in IGV genome browser show different situations.
For some genes, the 3’-skew is more noticeable
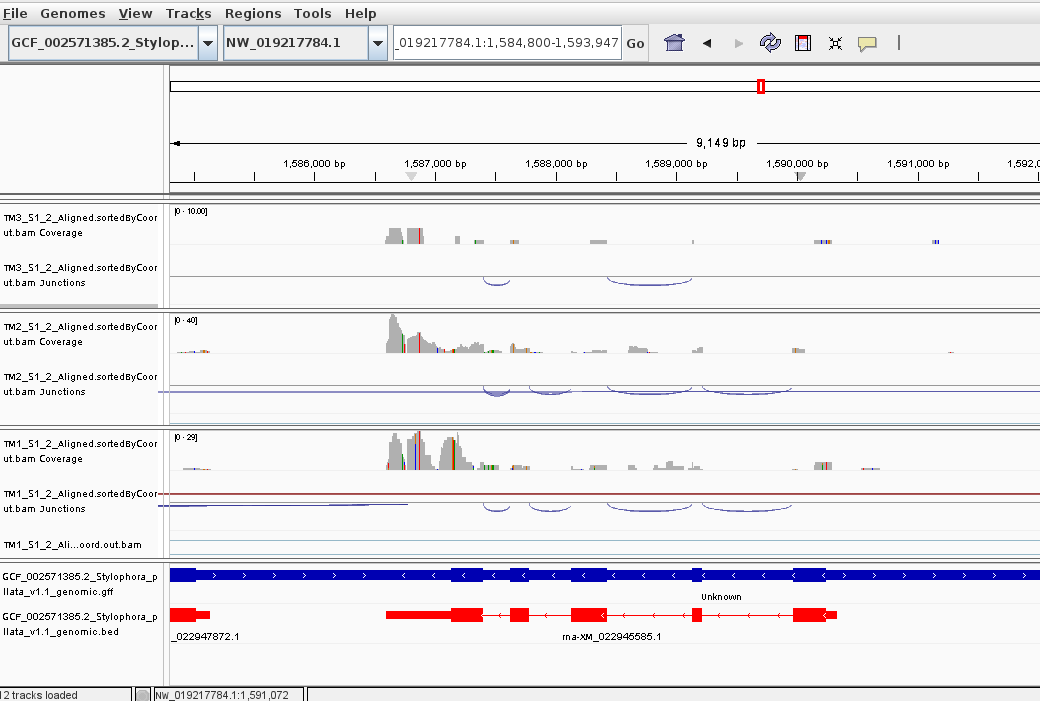
For some genes, reads are almost uniformly distributed across transcript.
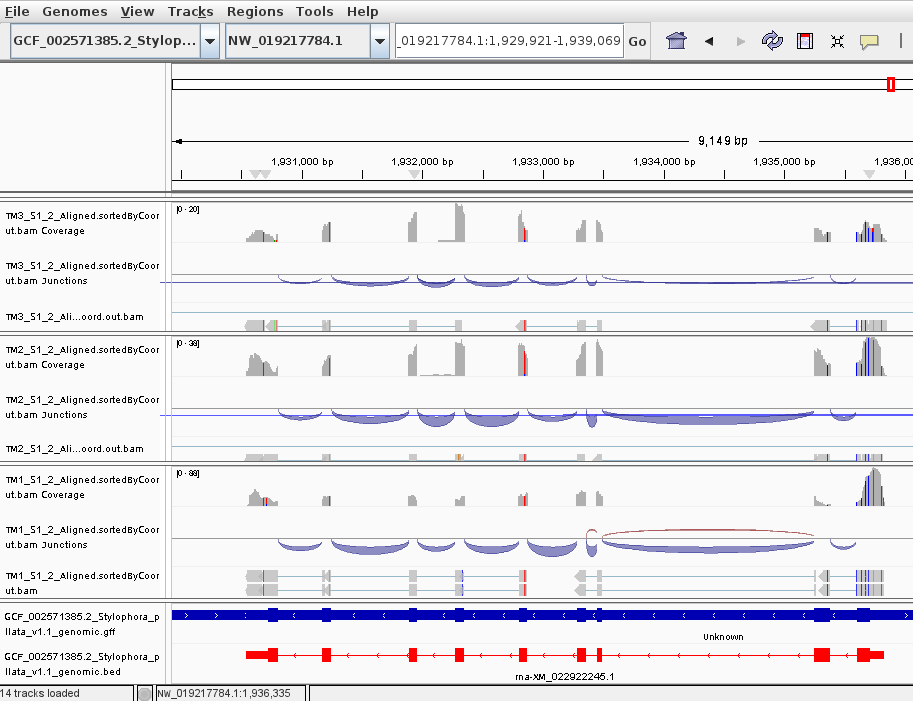
It can be seen, that in TM3 sample the sequencing depth really affected the resolution of the experiment - some transcripts are totally lost.
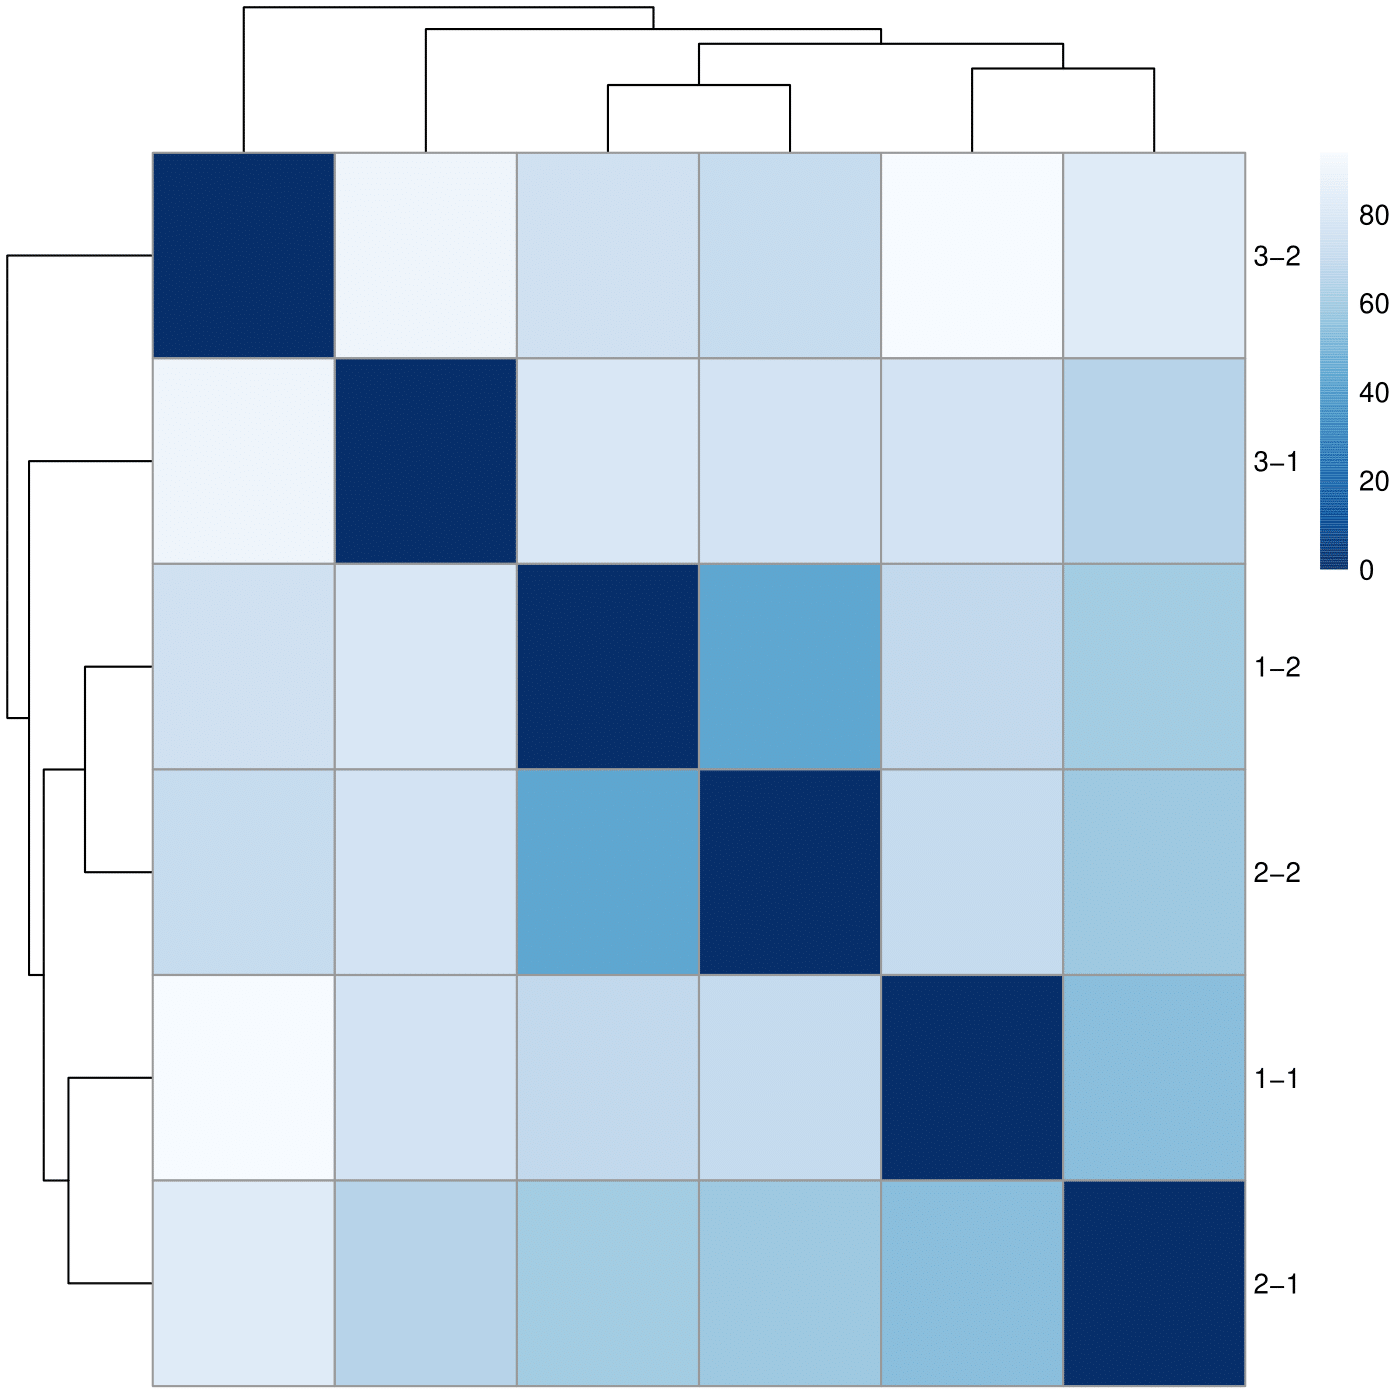
Clustering
I tried to run a simple DE analysis on this data just to test if everything looks fine: prep TM3 behaves differently than TM1 and TM2 and two samples from this prep cluster together, while the samples from TM1 and TM2 cluster according to the sample name, which seems to be more valid clustering.
Summary
Overall, the sequencing quality is good, we have no contamination and most of the reads align to a genome in each sample. The most significant difference between preps is sequencing depth - I am not sure whether it’s an effect of a prep method or something went wrong during the pooling step. The other important observation is the strandness of the libraries - TM3 for some reason is not stranded, while TM1 and TM2 are stranded. The last observation is regarding the gene body coverage of each library - I expected it to be more skewed towards the 3’ end, but in TM1 the 5’ end is also covered, and even in TM2 and TM3 the coverage plot is not that steep. TM2 prep seems to have the best results across all preps, but TM1 is also ok.